



Track an AI tool or agent rollout
Licence counts are not adoption. This programme measures whether an AI rollout is actually landing: real usage from live systems, capacity realised against what was projected, and drift caught early.
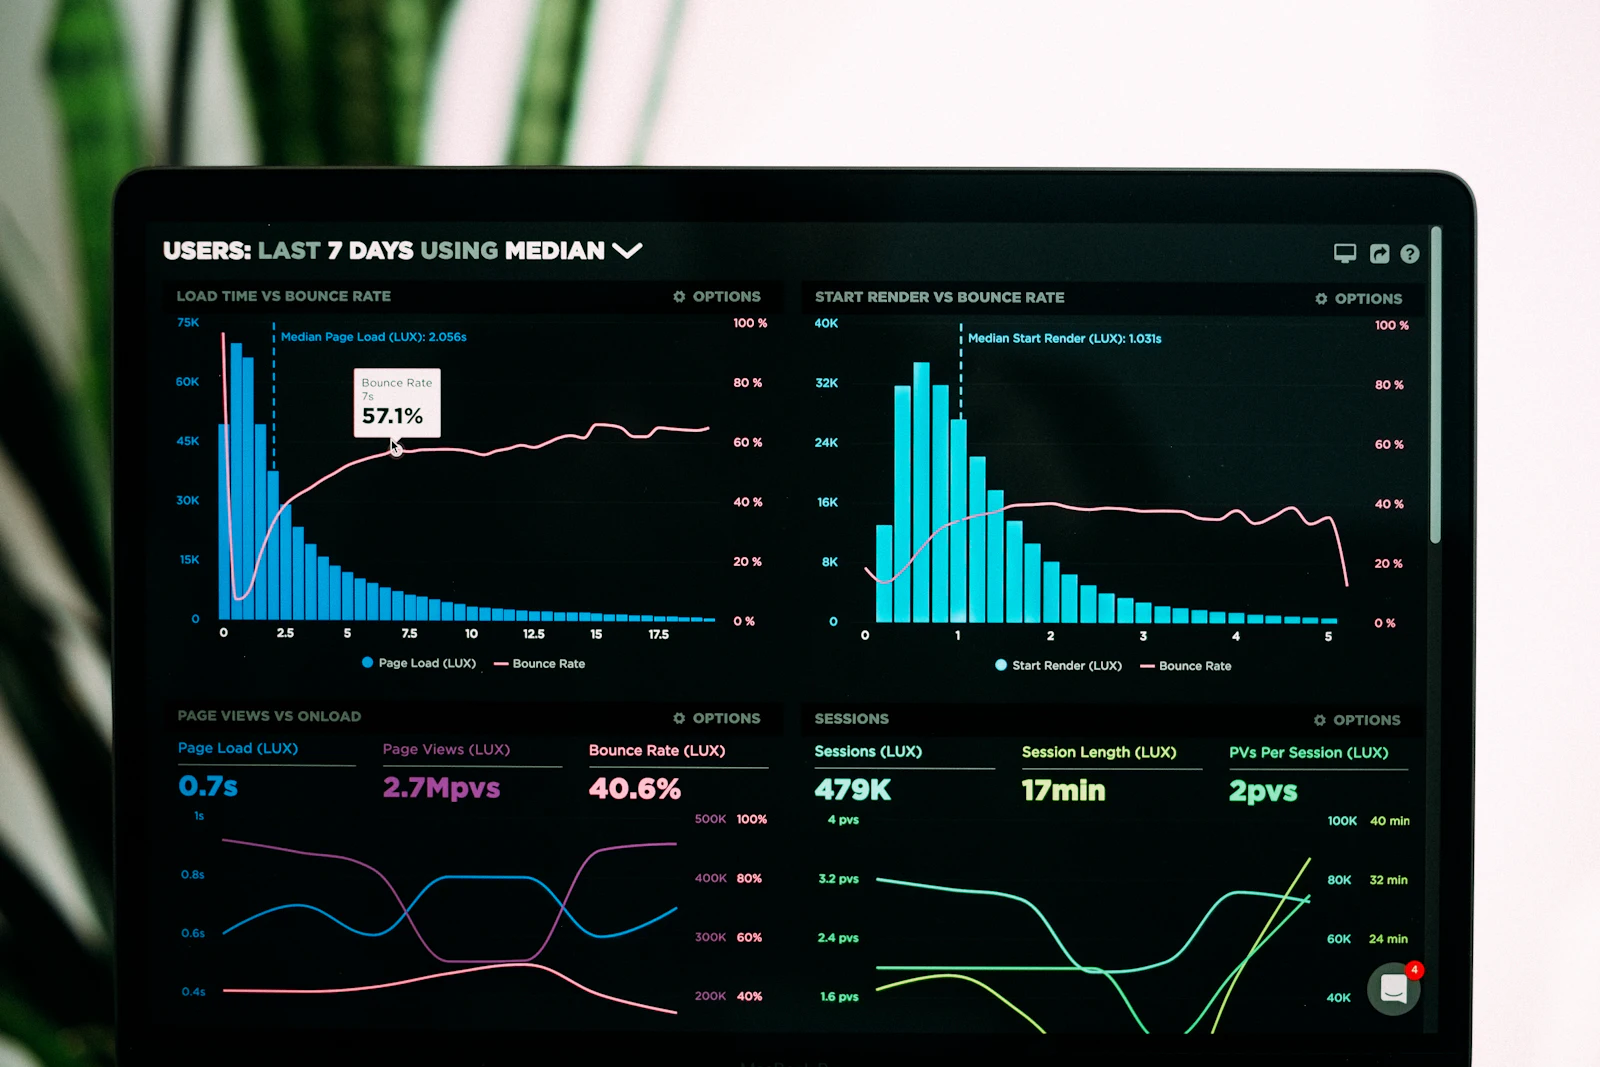 09Traction
Continuous · live from your systems
Licence counts are the vanity metric of AI transformation.
Most AI rollouts are declared successful at the moment of purchase. Licences assigned, onboarding complete, a launch email with rocket emoji, and the programme moves on. Six months later somebody checks and finds that usage collapsed in week three for everyone except the champions, the projected capacity never materialised, and the renewal is due. The tooling was measured; the adoption never was.
Login statistics do not fix this, because logging in is not working differently. Real adoption is only visible in the work itself: actual prompts, completions and workflows run, mapped against the tasks the rollout was meant to absorb. That mapping is what turns a usage log into an answer to the only question that matters: is the work actually moving to the new way, in the places we predicted it would?
Adoption you cannot see in the work itself is not adoption. It is a licence count.
When adoption stalls, and it usually stalls somewhere, the stall has a diagnosis. A training gap, a workflow mismatch and a tool problem look identical in a licence report and completely different in task-level data, and each one has a different fix. Guessing wrong wastes a quarter; the point of live measurement is that you stop guessing. Realised capacity tracked weekly against the Discovery projection keeps the business case honest in both directions, and catches drift back to the old way while it is still a nudge rather than a write-off.
This programme is the difference between hoping an investment landed and knowing where it landed, where it did not, and exactly what to do about it, within weeks.

What this programme does.
Signals come from the systems you already use: actual prompts, completions and workflows run, mapped to the tasks the rollout was meant to absorb, so you see adoption in the work itself rather than in login stats.
Realised capacity is tracked against the Discovery projection, week by week. Where adoption stalls, the data shows whether it is a training gap, a workflow mismatch or a tool problem, so the fix targets the cause.
From kickoff to landed.
Continuous · live from your systems
The signals switch on
Read access to the rollout tool's usage data or logs, the rollout plan and its capacity projection go in, with a named owner for the weekly signal review.
Usage mapped to the work
Prompts, completions and workflows run are mapped to the tasks the rollout was meant to absorb, so adoption shows up in the work itself rather than in login stats.
Realised versus projected
Capacity realised tracks against the Discovery projection week by week, by team and by task, on a live dashboard rather than a quarterly slide.
Drift caught, cause diagnosed
Where adoption stalls, the data shows whether it is a training gap, a workflow mismatch or a tool problem, so the fix targets the cause while correction is still cheap.
What you get.
Living documents, not slideware: every deliverable stays connected to the graph and updates as the analysis moves.
Live adoption dashboard
Usage by team and task, against the rollout plan.
Capacity realised tracker
Hours actually freed versus projected, updated weekly.
Drift alerts
Early warning when usage stalls or reverts to the old way.
What you need.
- Read access to the rollout tool's usage data or logs
- The rollout plan and its capacity projection
- A named owner for the weekly signal review
The questions teams ask about this programme.
What systems can you read signals from?+
Any rollout tool that exposes usage data or logs: AI assistants and copilots, agent platforms, and the workflow systems around them. Signals come from systems you already run; there is nothing new to deploy to your teams.
Is this monitoring individual employees?+
The unit of analysis is the work: adoption by team and by task against the rollout plan. The question it answers is whether the investment is landing and where to intervene, not who typed what, and the signal scope is agreed with you before anything switches on.
How quickly do we see a signal?+
The dashboard is live from the first mapped week. Meaningful adoption patterns typically show within two to three weeks, which is the point: knowing in weeks, not quarters, while intervention is still cheap.
What does 'capacity realised' actually mean?+
The Discovery analysis projected hours freed per role as AI absorbs specific tasks. Capacity realised measures how many of those hours are actually materialising, based on real usage mapped to those tasks, so the business case is tracked in the same units it was made in.
What happens when adoption stalls somewhere?+
The data localises the stall and points at the cause: teams that never started suggest training, teams that started and reverted suggest workflow mismatch, universal shallow usage suggests a tool problem. Each has a different fix, and the tracking shows whether the fix worked.
Programmes compound.
Each programme deepens the same graph the next one runs on: nothing is re-gathered, nothing starts from zero.
 The natural next step · Programme 01 · Discovery
See how AI has impacted your roles
Traction feeds the next Discovery: as adoption reshapes the work, re-baseline the roles and the loop keeps compounding.
View programmeExplore next
Traction
Track the change and keep the gains compounding.
Read moreTrack vendor consolidation
Savings banked, migrations verified
Read moreTrack L&D progress
Capability built, measured in the work
Read moreThe Missing Layer in Your AI Transformation Is Human
77% of leaders say their AI strategy is defined and shared. Just 23% say their workforce is ready, and that number fell as adoption climbed. The gap has a name: the human layer, and it's where AI transformations are quietly dying.
Read moreYour AI Transformation Is Firing Your Greatest Asset
Most AI transformations open with a headcount cut, and that removes the very capability the transformation runs on. Roles are the sum of their tasks, and redeployed time, not freed time, is where the return comes from.
Read moreEngagements
How an engagement runs, week by week.
Read more
Start with this programme, on one department.
Know within weeks, not quarters, whether the investment is landing, and exactly where to intervene.